 |
 |
Discover
Discover and combine with Power Query for Excel
The data you want, the way
you want it
Easily discover and connect to data from public and corporate data
sources. This includes new data search capabilities, as well as
capabilities to easily transform and merge data from multiple data
sources so that you can continue to analyze it in Excel.
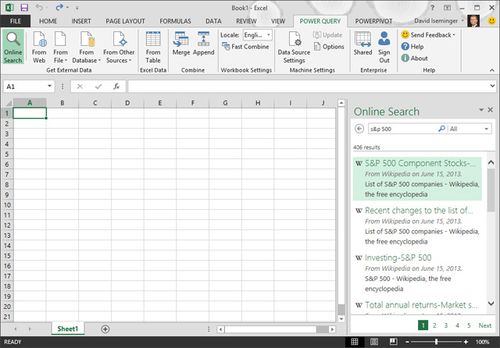
Search and find data
Online search helps you easily find data from both inside
and outside your organization. Just type what you're looking
for and in seconds Power Query will give you a list of all
the available data sources that match your criteria. Preview
the contents of the data and import the data source that you
want directly into Excel.
 |
Analyze
Model and analyze with Power Pivot for Excel
The bigger the data, the more powerful we are
Continue to create sophisticated data models with that data in Excel
by creating relationships, custom measures, hierarchies, and KPI's. All
with the increased performance of in-memory technology.
Build your model and start your analysis
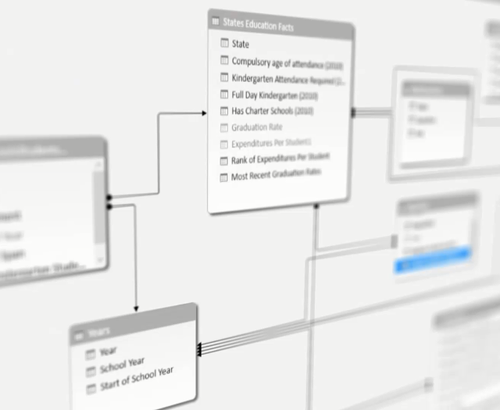
With Power Pivot, you create your own data model from
various data sources, modeled and structured precisely to
fit your needs. You can refresh from its original sources as
often as you want. You can format and filter your data,
create calculated fields, define key performance indicators
(KPIs) to use in PivotTables and create user-defined
hierarchies to use throughout a workbook. You can even
author your own calculations by writing advanced formulas
that use the Data Analysis Expressions (DAX) expression
language. No need to be a SQL expert: manage the model and
create relationships using drag and drop in the Diagram
View.
 |
Visualize
Visualize with Power View and Power Map for Excel
Data tells a story
Use Power View to create reports and analytical views through
interactive charts and graphs that help you explore and present your
data visually in Excel. Explore and navigate geospatial data on a 3D map
experience with Power Map.
Presentation-ready
A Power View report is always presentable – you can browse
your data and present it at any time because you're working
with real data. You don't need to preview your report to see
how it looks.
Power View in SharePoint has reading and full-screen
presentation modes, in which the ribbon and other design
tools are hidden to provide more room for the
visualizations. The report is still fully interactive, with
filtering and highlighting capabilities.
 |
Share and Collaborate
Share and collaborate with Power BI Sites, data management and the
Admin Center
Share your data with the world
Power BI Sites is the heart of your collaborative Power BI
experience. Quickly create collaborative Power BI Sites for your team to
share and view reports. Share queries created by you and easily find
queries created by other people in your organization. Connect to
on-premises data sources and schedule refreshes for your reports.
Insights for everyone
Power BI Sites allows you to upload the reports you created
and share them with anyone on your organization. Users get
the same dashboard interactivity through the browser, making
it easier to consume data and insights. You can customize
your Power BI Sites gallery to feature and highlight
specific reports.
 |
Ask Questions
Get answers and insights with Q&A
Ask a question, get a truly incredible answer
With an instantaneous experience that uses natural language
query, Q&A interprets your question and immediately serves
up the correct answer on the fly–in the form of an
interactive chart or graph. And these visualizations change
dynamically as you modify the question, creating a truly
interactive experience with your data.
 |
Access Anywhere
Take your data with you
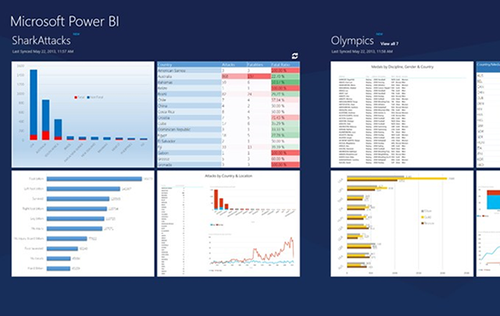
Microsoft
Power BI Windows Store app provides live mobile access
to the important business information stored in your Office
365 account. With the Power BI app, you can view and
interact with Excel and Power View content on any Windows 8
or Windows RT tablet or PC, including Surface. HTML5 support
for Power BI Sites allows users to consume Power BI reports
virtually anywhere, on any device.
 |
 |
|

|
|


